Identifying Vulnerable Populations Amid Climate Change
A SAS Hackathon project analyzing economic and climate vulnerability to support policy-making for at-risk communities.
This project was developed for the 2024 SAS Hackathon under the theme “Vulnerable Populations vs. Climate Change.” Our team, ORSOL, tackled the overlapping crises of climate change and economic vulnerability, aiming to identify and support communities most at risk. (Awarded 1st place in Data Analysis as Global Student Winner, competing with 145 teams from 70 countries.)


Abstract:
Climate change intensifies the frequency and severity of extreme weather events, disproportionately affecting vulnerable populations such as low-income families, rural communities, the elderly, and marginalized groups. This project integrates climate and socioeconomic data to identify the top 50 U.S. counties most vulnerable to climate-related disasters, providing data-driven insights for policymakers to allocate resources effectively.
Key Components
-
Data Sources and Processing:
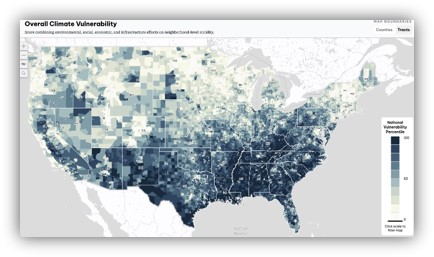
We analyzed multiple datasets to capture climate risks and economic vulnerability:- 5th National Climate Assessment (NCA5): Provided climate projections and environmental impact data.
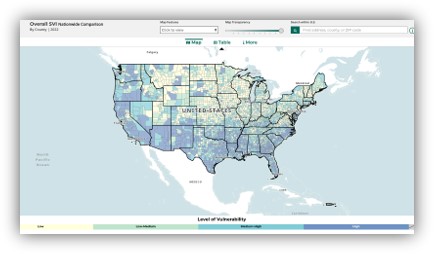
- Social Vulnerability Index (SVI): Highlighted economic vulnerability and public health preparedness.
- Bureau of Labor Statistics (BLS): Supplied local area unemployment statistics.
- U.S. Census Bureau (SAIPE): Delivered small-area income and poverty estimates.
Data cleaning involved addressing missing values, encoding issues, and removing rows with incomplete county information to prepare a high-quality dataset.
-
Methodology:
A scoring system was implemented to rank counties based on risk factors:- Preliminary Approach: Ranked counties using raw variable values but found this method failed to capture variable interactions.
- Revised Approach:
- Constructed a correlation matrix to evaluate variable relationships.
- Developed a weighted scoring system assigning higher importance to critical factors.
- Applied MinMaxScaler in Python to normalize scores between 0–10.
-
Visualization and Dashboard:
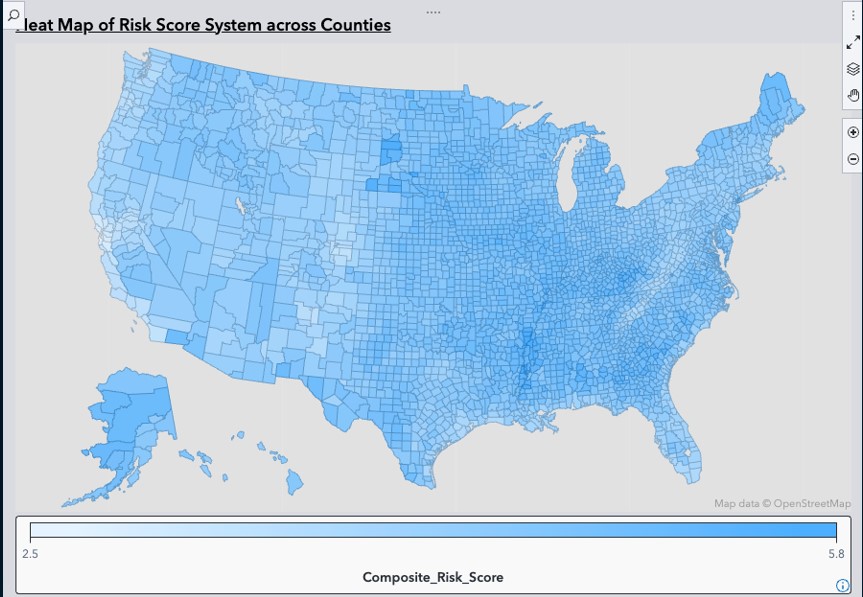
A SAS-based interactive dashboard demonstrates the analysis results, providing clear visualizations of county-level risk scores.
Results and Policy Recommendations
-
Findings:
The project identified the top 50 vulnerable counties, with key insights into their risk profiles:- Example: Phillips County, AR (Score: 5.79/10) exhibited high heat extremes and poverty rates.
- Barbour County, WV (Score: 4.17/10) showed significant flood risks and poverty rates.
-
Recommendations:
To mitigate risks and support affected communities, the following policies are proposed:- Invest in Resilient Infrastructure: Strengthen flood defenses and heat-resistant buildings.
- Economic Support Programs: Offer job training and financial relief in vulnerable counties.
- Healthcare and Disaster Response: Improve healthcare facilities and emergency systems for climate-related crises.
Technical Stack
- Data Analysis Tools: Python, SAS Viya
- Key Techniques: Data cleaning, correlation matrix, weighted scoring, dashboard visualization
Conclusion
The project demonstrates how integrating climate and socioeconomic data can provide actionable insights to address the compounded challenges of climate change and economic vulnerability.
